You can print multi-school reports and graph detailed Work Placement information across a range of schools for analysis.
For example, assuming you have imported several schools' data files into WorkExpo; you can gather statistical information for placement type and employer size by school. Follow these steps to generate this information.
- From the WorkExpo main menu click the large Print button to start the Print Wizard.
- Choose Miscellaneous / Program Statistics
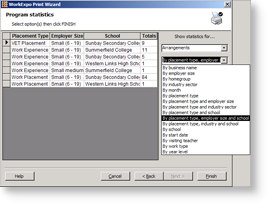
- In the Program Statistics dialog box under Show Statistics For , choose Arrangements, then By Placement Type, Employer Size and School

 Click to enlarge
- WorkExpo will calculate the statistics for the request and display them in the wizard.
- You have the option of printing these statistics by clicking the Finish button which will send the details to the printer or...
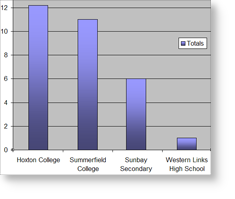
- Alternatively you can chart the statistics by selecting them and then copying to the clipboard. (Ctrl + C or choose COPY from the right-click shortcut menu) and then...
- Pasting them into Excel and pressing the F11 key. The F11 key in Excel will generate a graph or chart of the statistics.
See Also
